Predictive Healthcare: Mobile, Continuous Diagnostics and Data Collection with Brain Computer Interfaces
Alice is excitedly heading to her English lecture hall on the top floor. Her professor is going to introduce Mark Twain today! But as she hurriedly climbs the stairs, she receives an alert on her phone. It says that she'll be experiencing a seizure in 15 seconds and should find a safe spot soon. Alice groans, "Not again!", and quickly climbs down the stairs, lying down on the floor before the seizure begins.

What if there was no alert, and she experienced the seizure while climbing the stairs?
Reality is, there wasn't an alert. Not for her. And not for 50 million other people. These people live with the fear of experiencing a seizure anytime and anywhere. Living with this uncertainty is their new normal. It shouldn't be.
If we can do something to help her quality of life with a little bit of seizure control, we will take it. We were willing to try anything. -- Stacy, a mother, talking about her daughter Emily (The Epilepsy Foundation)
Today, we mostly measure health parameters and vital signs at the so-called point-of-care. This can be a physician’s office, the clinic, the hospital or a clinical laboratory. You have to go there, wait patiently in front of the doctor’s office and eventually someone will examine your symptoms. With technological advancements taking place in portable diagnostics, algorithms and sensors, the act of measuring health parameters and vital signs becomes more convenient, mobile and cheaper.
We already have different wearables and sensors available to the public for various wellbeing and health applications. They can e.g. measure your blood pressure or heart rate, whether your food contains gluten, or the electrical activity in your brain or muscles. What if these new sources of data can shift our relationship with healthcare from reactive to proactive?
Electroencephalography (EEG) is an electrophysiological monitoring method to record the electrical activity of the brain. Electromyography (EMG) is an electrodiagnostic medicine technique for evaluating and recording the electrical activity produced by skeletal muscles. EEG and EMG can be used to measure the musculoskeletal and brain activity against various treatment interventions like the medicine intake. This creates an interesting opportunity for collecting real world data for understanding the disease stage, progression, treatment efficacy, and also for clinical trials.
Aalto University collaborated with Futurice and Orion Pharma to explore how EEG and EMG signals from commercially available devices could be analysed to identify patterns. Aalto University selected a group of students to work on the project, Futurice provided mentoring in Software Design, Project Management, and Data Science while Orion Pharma provided the domain expertise in creating digital medical grade testing solutions and algorithms.
Ambitious start gets a reality check
Initially, the plan was to use EEG and EMG signals to understand the progression of a disease, specifically Epilepsy. This could help in understanding how the disease was reacting to the medication. Accordingly, our hardware combination was Emotiv Insight to track EEG Signals, and OpenBCI Hardware to track EMG Signals. This choice gave us the maximum input channels (5 + 4) with decent quality while being budget-friendly.
After a couple weeks of research, it was understood that our initial hypothesis, using EEG and EMG signals to track disease progression, was not feasible . This was because Epilepsy is a long-term disease that spans decades.Thus the amount of data needed to effectively track it's progression is huge, and there was no public dataset of that size available to us. Additionally, although there were relevant separate EEG or EMG datasets available, none of them tracked both EEG + EMG at the same time. And without the data, it was not possible to create a data analysis model that incorporated both of them. A closer look into the existing research revealed that there was a lot of effort to predict epileptic seizures and that this was an extremely important research area.There were machine learning models that were achieving accuracies of > 95% while detecting and predicting epileptic seizures using EEG Signals. It was concluded that replicating a detection model during the 2-month project timeline would serve as a strong platform to build more robust prediction models in the future. Those models could build on and solve problems experienced by the models taken as references to this study.
Building the Model
Our models were trained on the Bonn University Dataset which is the most widely used public dataset for Epilepsy detection and prediction. It consists of 5 sets (A, B, C, D, E) of EEG Signals, each set containing 100 channels with 4097 data points equivalent to 23.6 seconds of data. Set A: Healthy Volunteers while relaxed, awake, and with their eyes open. Set B: Healthy Volunteers while relaxed, awake, and with their eyes closed. Set C: Epileptic Seizure-free Intervals (Location: Hippocampal Formation) Set D: Epileptic Seizure-free Intervals (Location: Epileptogenic Zone) Set E: Epileptic Seizure Activity K-Means Clustering to detect Epileptic Seizure Activity and Pyramidal 1-D Convolutional Neural Network to detect Epilepsy were built based on the available datasets.The K-Means Clustering is an unsupervised model that partitions n samples to k clusters. Each data point is partitioned to the cluster with the closest centroid, calculated using soft-Dynamic Time Warping. It returned a 94% accuracy - 377/400 time series were classified correctly with 0 type 1 errors and 23/400 time series were misclassified as type 2 error.
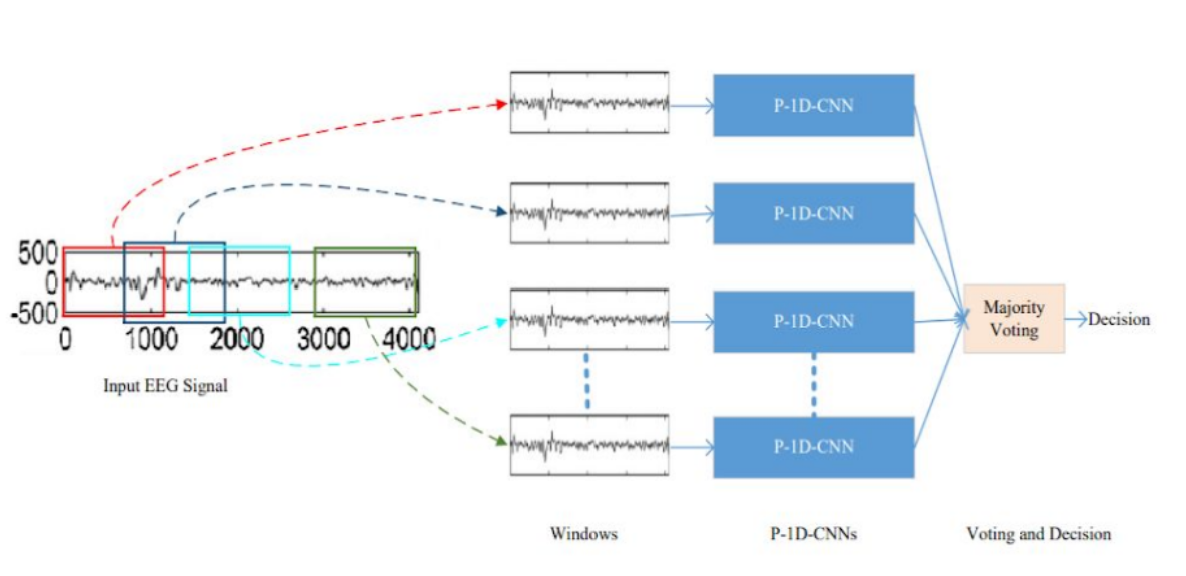
P-1D-CNN is a deep learning model that can efficiently handle limited data and achieve higher precision. It's divided into 3 steps. Firstly, the EEG signals are fragmented with fixed-size overlapping windows, and then each fragment is classified with the corresponding P-1D-CNN model. The final result is obtained by a majority voting of all the models. The model then was simplified by only implementing one P-1D-CNN to classify the signals.
Each P-1D-CNN model consists of 3 convolutional blocks to extract features, two fully connected layers with a dropout that acts as a filter to eliminate unimportant features, and finally a classification layer. Each convolutional layer, in turn, consists of 3 layers which are Convolution1D, Batch Normalization, and Rectified Linear Unit. The softmax layer was replaced for classification with a sigmoid function because it was deemed easier for the use case. To make sure that there is enough data to fit the model, the team implemented data augmentation to generate artificial data.
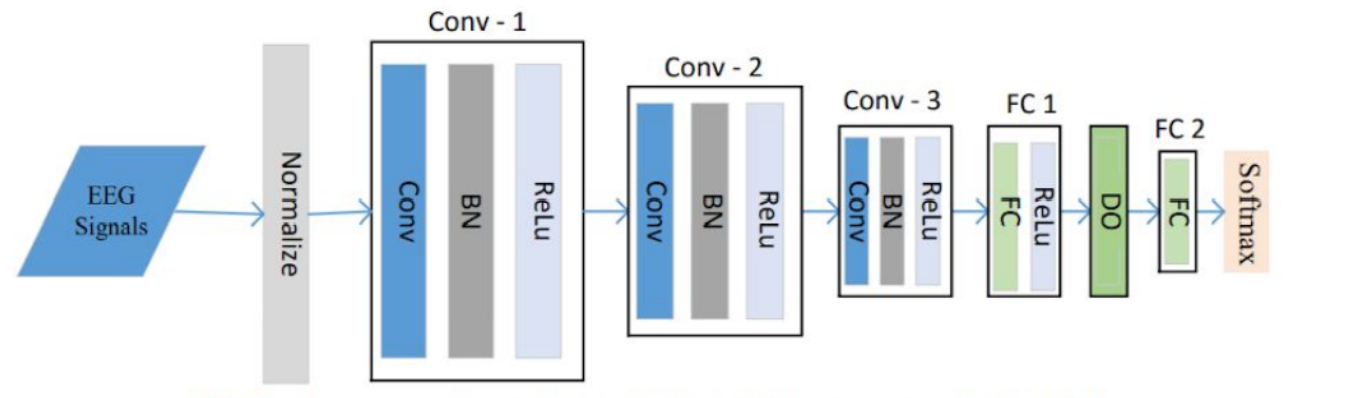
Fig: One P-1D-CNN ModelThe model achieved an accuracy of 95.83% from the validation set. Performing cross validation with 10 folds resulted in an average accuracy of 82.86%.
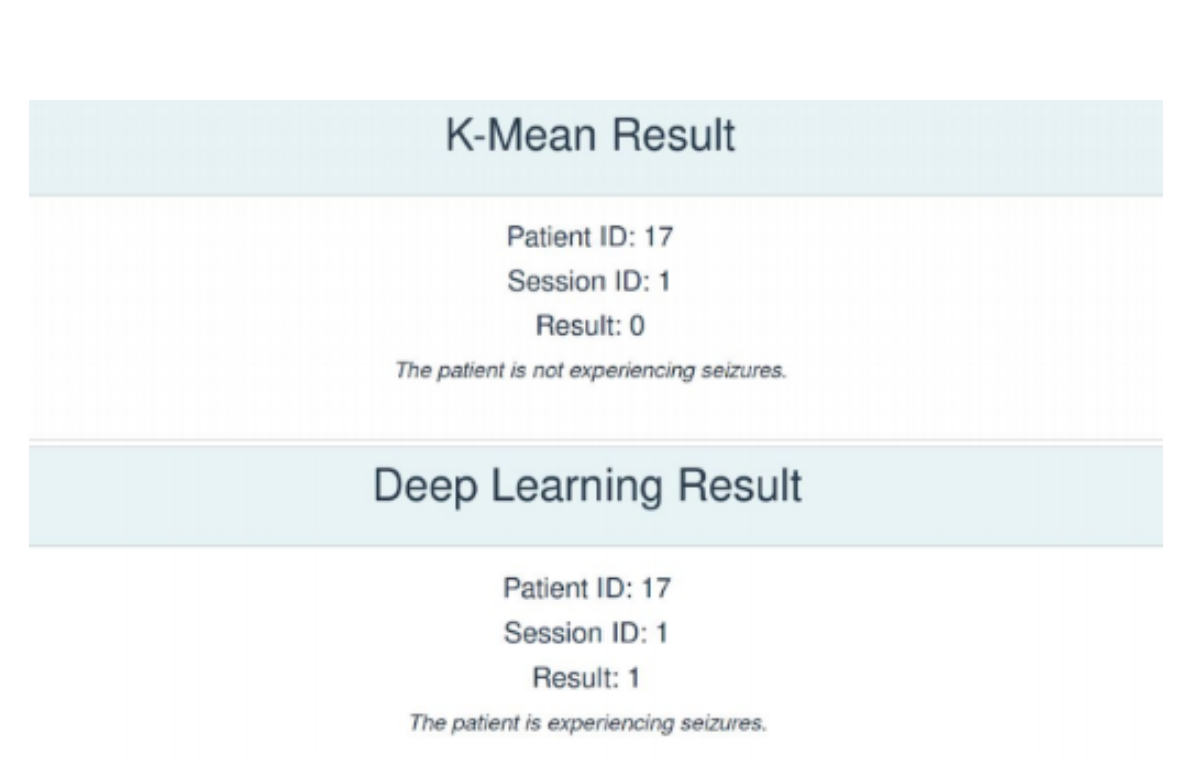
Testing our models on a healthy teammate's EEG Data, it was observed that while the K-Means Clustering model provides the correct result, the P-1D-CNN model does not. This is because currently, our classification function for the P-1D-CNN model naively sets the classification boundary as 50%. This can be refined using an ROC Curve to better reflect the data's threshold for classification.
Regulated vs Unregulated Data in Healthcare Research
The prototype makes a strong case for portable diagnostics. Lowering cost and risks associated with treatments and clinical trials is in everyone’s best interest. Especially in the long-term interests of the stakeholders. That said, this prototype has a long way to go just like its predecessors. It faces the same challenge that blocks the path to further improvements - lack of sufficient data for training. There is a clear need to create a larger dataset that represents a variety of people and conditions. Data that is collected at point-of-care, i.e. regulated data, can be augmented with unregulated data from mobile devices with health apps, direct-to-consumer genetic testing, crowd-sourced information, and other portable diagnostic tools. This combination can act as the first step to close the gap and harness the potential of digital health to facilitate an era of more accessible, coordinated, and personalized care. However, the path is not straightforward. Measuring health signals in a non-controlled environment requires a rigorous process for screening the incoming data. In addition, the need for designing and developing process that simplifies and incentivizes labeling and sharing of data, makes the problem a service design and cybersecurity challenge as well as data science one.
This blog post is written by Aayush Kucheria representing the student team that have developed and tested the prototype over the summer.
 Tuğberk DumanHead of Innovation

