How to maximize customer and business value using measurable journeys
It's no secret that listening to your customers makes good business. To succeed, we collect an increasing amount of customer data, map their journeys and include designers in our teams. But how does this impact your operations on an organizational scale? Is the data collected useful, seen and actionable by those who can make the changes? How do you manage the multiple moments of your many services? This article introduces 'Journey Operations' and why it works.

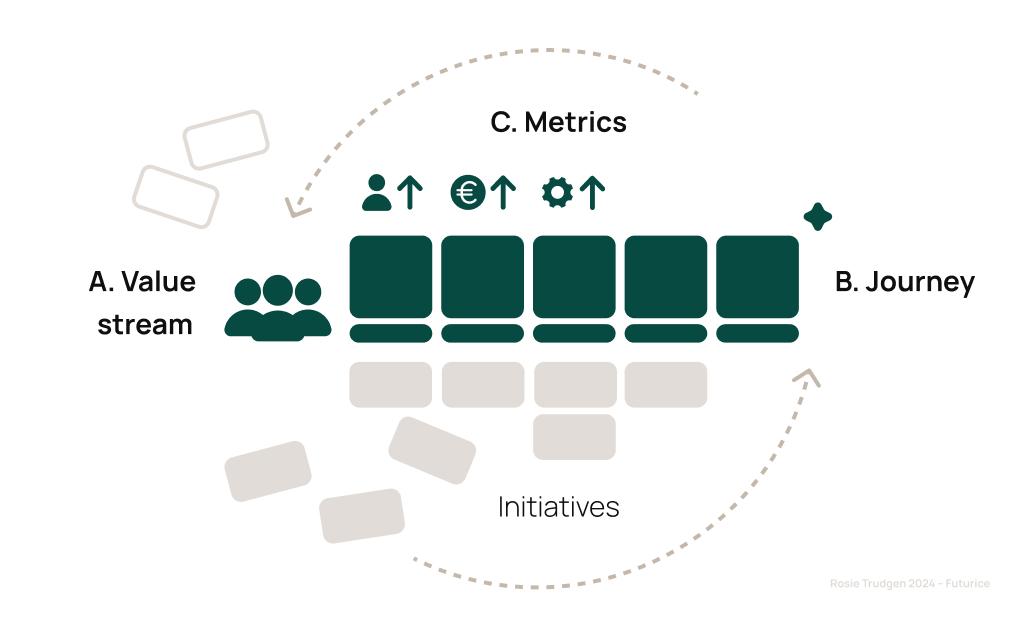
Journey Operations enables organizations to measure, manage and continuously improve services using journeys
Journey operations consist of three key components that work together within an agile system:
A. Value stream – The team responsible for the service, often organized around delivering value
B. Journey – The shared big picture of a service from a customer point of view
C. Metrics – Qualitative and quantitative data needed to evaluate the health of a service
A. Value stream
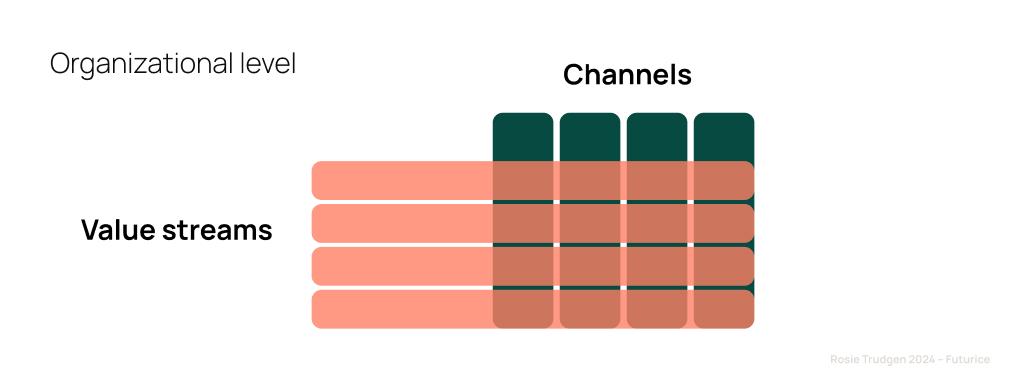
Let’s start with the product team. Traditionally we see teams organizing around channels. For example, one team will govern retail, one for the website and another for the application (channels). Though this is useful to keep those with the technical knowledge in one place - it’s not great for the customer. Let’s say I want to send a parcel or maybe sell an apartment. I will interact with many channels and people over a period of time, to achieve that goal. A team governing only a website would receive information from many people trying to achieve many goals, covering the whole range of what a company offers. This is very hard to design for, resulting in a fractured end-to-end customer and product team experience.
Alternatively, Journey Operations forms teams around delivering that value to your customers: called ‘Value Streams’. In my experience, great value streams are often named with ‘verbs’ - that signal the customer's goal they enable e.g. sending, renting, tendering, ordering, installing, etc. As a result, an organization will typically have several Value Streams depending on the complexity of their value chain and size of the team needed to manage them. In addition, value streams give leadership a snapshot of how well value are being delivered throughout their value chain to allocate investment.
Successful streams include team members with three lenses:
- Business: Those who consider the business impact and needs of a service
- User: Those who champion all users' experiences, especially the customer
- Tech: Those who enable the delivery of the service in the most effective way
Together the team creates services that are: technically feasible, customer desirable, and business viable.
B. Journey
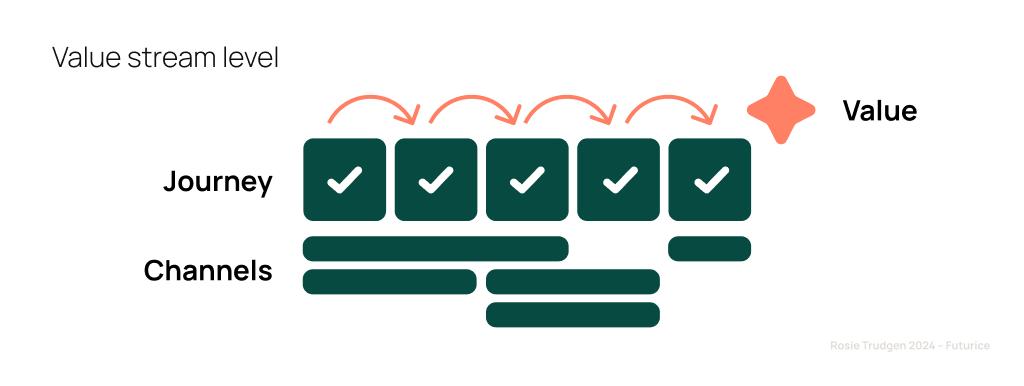
Teams flourish with a shared end-to-end picture of their service: the journey. The journey connects all the activities that go into delivering viable value to your customer. A great way to kick off a value stream is to create the journey together, as a team. This way, everyone knows where to find it, how to use it and their role in delivering value.
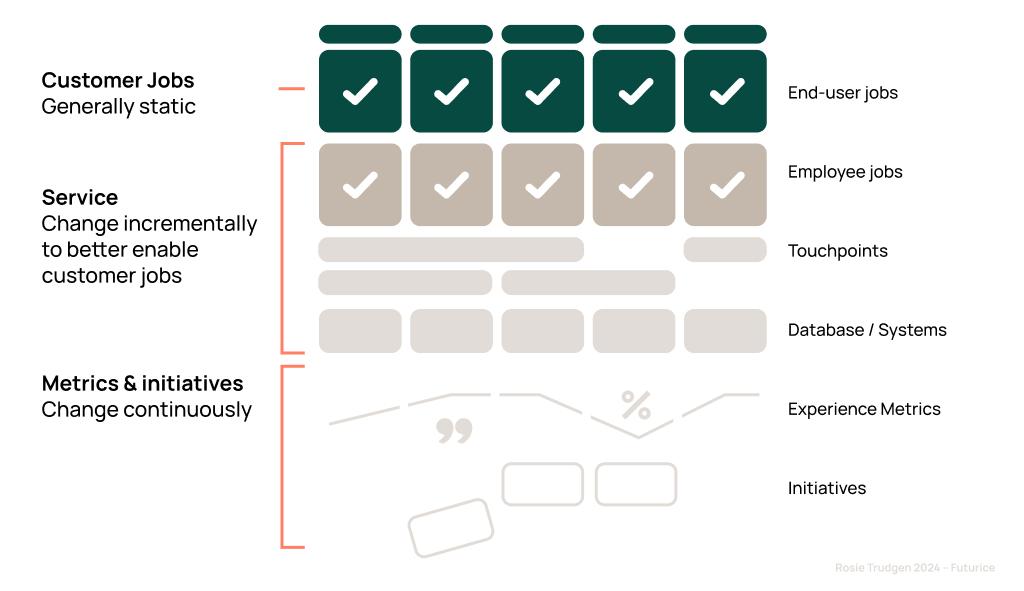
Headlining your journey are the 'Customer's Jobs'. ‘Jobs’ are the; social, physical, and emotional tasks your customer is trying to do (e.g. know when their taxi arrives for pickup) to achieve their goal (e.g. arrive at their destination). Jobs should be validated to reflect your customer's real-life actions, and not just describe your service. The layers below document how your service delivers the value, such as; employee jobs, touchpoints, stakeholders, systems,etc., creating a complete ‘service blueprint’. Finally, your customers' experience, is the result of how well your service enables them to perform their jobs in order to ultimately achieve the value of your service (more on metrics below).
With Journey Operations, the journey becomes the backbone of your continuous innovation process - where insight, and initiatives can be connected to a moment in your service.
C. Metrics
Now you have a team and a shared big picture of your service - but how do you know what to prioritize and improve? Continuous qualitative and quantitative data is useful on two levels of detail. On a high level, ‘journey metrics’ gives your team the pulse of how healthy your service is doing overall. On a more detailed level, ‘experience metrics’ indicate where the issues are occurring.
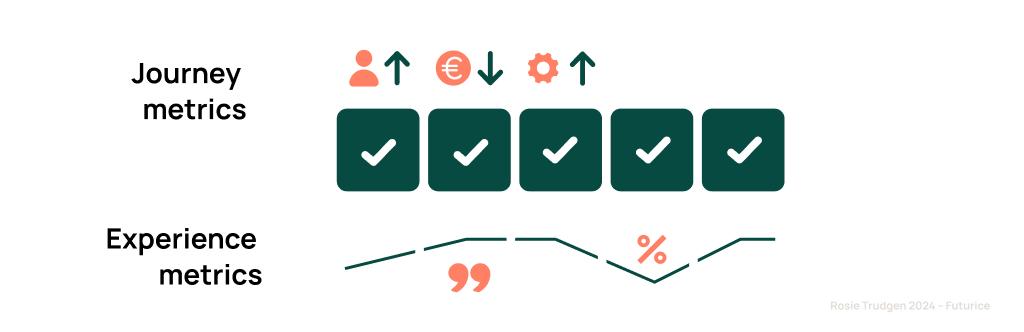
Journey metrics
Key journey metrics enable you to measure the (1) Business viability, (2) Operational performance, and (3) Customer experience, of your service. Some might recognise these as key performance indicators (KPIs) from three critical points of view.
To define these metrics, first ask the question: what is my customer, business, and operational goal? Then, what do I need to measure to evaluate how well we are doing in these areas? For example: business metrics may measure the revenue from several charging sessions (€income), operational metrics may measure: Vol. customer service contacts & servicing costs (€cost) and customer metrics may measure overall customer satisfaction upon using the service (%CSAT). Key journey metrics allow all stakeholders to evaluate the overall success of each new initiative was and where to focus the next improvement efforts.
Experience metrics
Experience metrics are connected to each phase of the journey offering more detailed insight. They measure how successfully your customer is able to perform specific jobs resulting in a positive or negative experience, good or bad business. Experience data can be qualitative or quantitative. For example: qualitative feedback from customer service, or quantitative volume of contacts. They might also show user volume information to identify drop-offs or how many users chose one option over another. The goal is to have a continuous stream of actionable live data for continuous improvement. More mature teams will have a dashboard on a team and organizational level.
Once your journey metrics are in place, the success of your initiatives can be automatically measured because they are how you define service success. The difference with value streams also owning these metrics, is that they have the information to make decisions and drive informed change.
How it all works together
With these key artefacts: journey, metrics and valuesteams - you have the ingredients for continuously measuring, managing and improving your service. Here’s how it all works together;
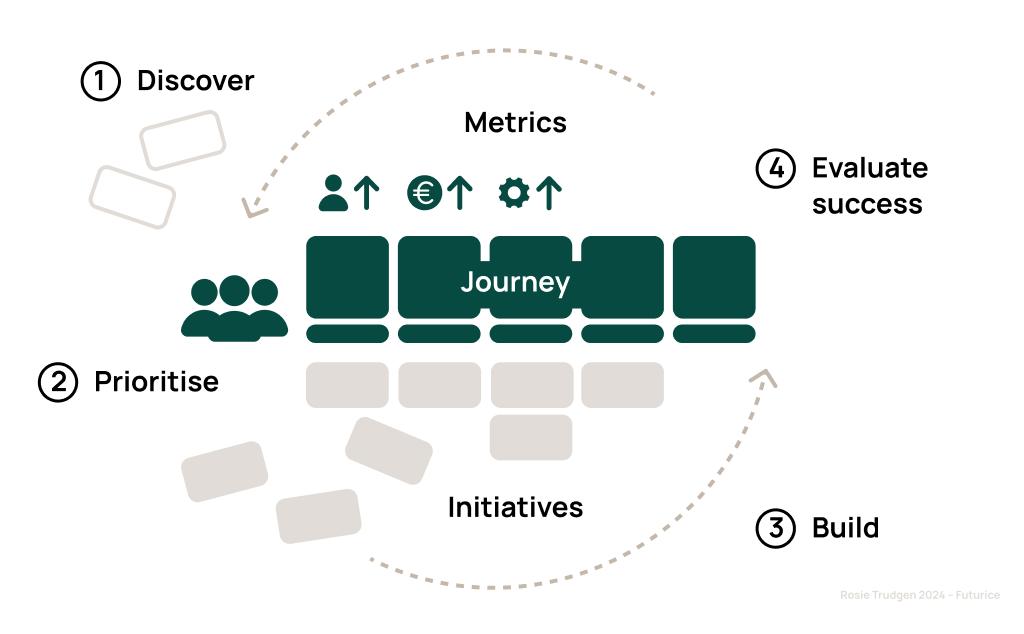
Using metrics, your team can identify opportunities to improve the: customer experience, operational efficiency, or business performance. A good metric set-up should give you evidence to prioritize the most impactful opportunities. If your origination utilizes a goal-setting framework e.g. OKR model, you can choose which opportunities might best help you to reach your objective.
Service and product design skills play a key role in validating how the problem is understood and best way to solve it. This not only maximizes the opportunities to elevate the customer experience but limits the risk of investing in something that doesn't add the value you are expecting. Once your solution is defined as an initiative (a solution with a clear problem to solve within 1-3 months of development), you're ready to build. Each initiative should include success metrics that you can evaluate before and after results.
Through this approach, organizations can make informed decisions to continuously deliver customer and business value. Service teams have a shared view of the services they are responsible for, and full agency to deliver value. Where to start and details of what works best depends entirely on the organization. In my experience, any transformation requires a topdown enablers and bottom up action. I’d always recommend, starting small e.g with one value stream, then scale what works.
 Rosie TrudgenLead Service Designer